Why Did Users Stop Engaging with this Feature?
Application of the Start-Stay-Stick framework on a sample feature

Your team is looking at usage metrics for one of your product’s main features, they are down but nobody knows what to do.
It’s all hands on deck, a daily meeting, regular reports upstream and brand new dashboards, all while developers and analysts try to understand the issue, and product managers share opinions.
Sir, I have a plan!
The resulting action plan is vague, and it’s unclear whether it is focusing on the right problem.
The Start-Stay-Stick lens
In part 2 of my User Engagement Blueprint, I define a lens which lets you look at problems like this by separating the overall engagement of a single feature into 3 separate parts:
- Start: “Are users discovering the feature or call-to-action?”
- Stay: “Are users following through until the end?”
- Stick: “Are users coming back?”
We create 3 separate calculations, identify the issue and solve the problems in this order.
Once separated and measured in the right way, where to take action becomes clear.
Calculating the metrics
In this example we will imagine we are building a fitness app, and the feature we are analysing is a Create Custom Workout feature.
We think back to the Start-Stay-Stick framework and measure rate metrics for each as follows: Successes over time ÷ Opportunities over time %
Since this is a trend based approach (which allows you to benchmark against yourself), the “over time” aspect is important.
For example:
- Start: Users who clicked “Create Custom Workout” in the last 30 days ÷ MAU %
- Stay: Users who clicked “Save Custom Workout” in the last 30 days ÷ Users who clicked “Create Custom Workout” in the last 30 days
- Stick: Users who clicked “Save Custom Workout” in the last 7 days ÷Users who clicked save workout in the last 30 days
Dashboarding the rate calculations
Once you have the data to calculate each rate percentage in the three-step KPI approach, you can visualise them as graphs.
For this I use a combi-graph timeseries: the rate percentage as the line, and the opportunities (the denominator of the calculation) as the columns.
For “Start” the visualisation may look something like this:
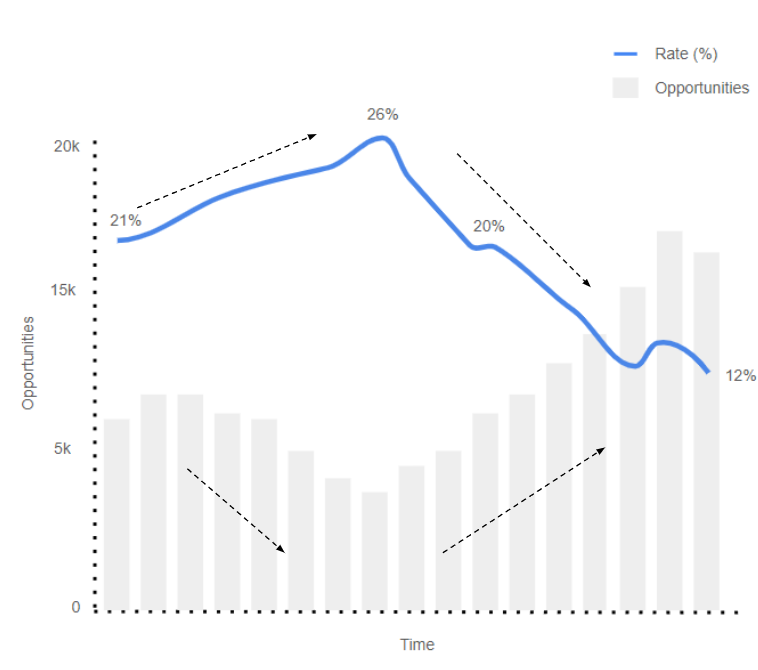
The timeseries, showing the change in rate and opportunities over time.
We can read the graph as follows: Despite MAU declining, an increasing proportion of the MAU were clicking into the feature. Once the MAU started to increase again, the proportion of users clicking into the feature declined steeply.
Effectively target areas for improvement
At this point, we can apply my decision matrix below and we land at the “need to capitalise on increasing opportunities”, that is to say: we need to convert the users coming into the app, to clicking on the CTA.
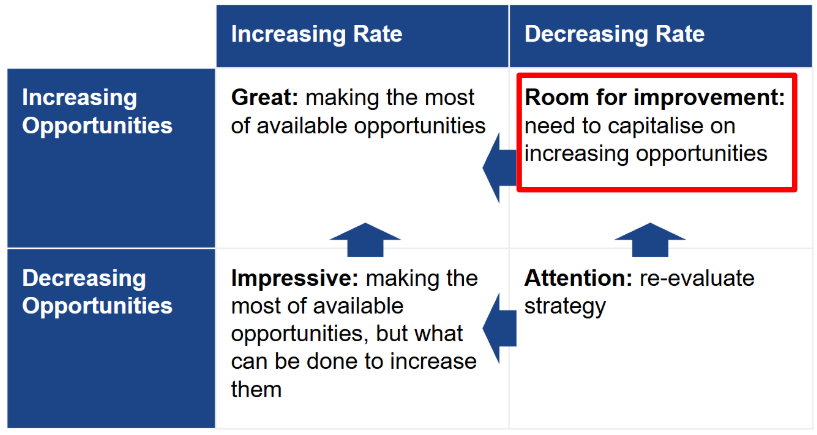
The decision matrix from the User Engagement Blueprint, with the relevant part highlighted.
The parts until now have given us the context for what is happening and some indication of where we need to target our solutions
From a vague plan to a specific one
Let’s think back to the meeting at the top of this blog post. The same issue, the same number in decline and the same roomful of opinions.
The difference now is that we can say something concrete: more users are arriving in the app and fewer of them are finding the Create Custom Workout CTA.
We know that we have a discovery problem on our hands, not a completion or a habit issue and this allows us to already rule out a number of the potential solutions that might have come up in ideation without this data-led approach.
Additionally, it is important to remember that the denominator for this part was people who are already in the app. Whatever is going wrong is going wrong inside the product, not upstream in acquisition - Part 1 of the User Engagement Blueprint actually discusses this.
The Start-Stay-Stick lens helps us to make fewer and better-aimed arguments about what to change next.
A solid action plan
The next step is implementing changes and proving they actually worked, this is where the A/B testing framework in Part 3 of the Blueprint comes in.
My User Engagement Blueprint provides exactly this holistic and structured approach to analysing the engagement issues you might be facing on your platform.
You can implement it right away if you’re already collecting analytics data by pointing this Start-Stay-Stick framework at one feature.
Stop wasting time coming up with ideas which won’t actually solve your problems.
Get started now - get The User Engagement Blueprint for free