How to Quantify the Benefits of Retention (Part 1)
overview of the retention benefit calculator, MAU Ceiling and monthly cohorts
Part 1: MAU Ceiling and monthly cohorts
This post is the third in a series where I break down what sits behind the headline MAU figure.
In the first post in the series, I spoke about how MAU is actually composed of 3 separate long-term cohorts, new users, retained users and re-engaged users.
And in the previous post, I showed how you can visualise the MAU metric in a few different ways that highlights the trends of those underlying cohorts and allows you to spot when acquisition is masking churn. That post closed on the spiraling cost of maintaining a MAU without quantifying it.
Calculating the benefit of retention
So, for that reason that I created a free Retention Benefit Calculator.
This tool allows you to enter the current state of your platform’s retention, and a target first-month retention rate that you aim to get to by applying the principles from the User Engagement Blueprint, and it will simulate the benefits you can reap from focusing your product roadmap on retaining users.
In this post (and its part 2 followup) I’ll walk through the theory and some numbers, to show you the huge benefits that focusing on retention can have for your app.
The numbers I’m using in the example are the default ones from the calculator:
| Metric | Example Value |
|---|---|
| New users joining per month | 10’000 |
| Cost per acquisition | €3.25 |
| Current first-month retention | 6% |
| Target first-month retention | 10% |
| Retention rate for users older than 1 month (applies both to target and current simulations) | 80% |
The CPA, current and target first-month retention are realistic benchmarks.
10k monthly new users and 80% post-1 month retention rate are for illustration purposes.
MAU hits a ceiling
One of our biggest lessons at LiveWell came too late, it was that spending on acquisition looked good because it bolstered headline MAU but every month’s new joiners churn over time, and eventually the users leaving each month equals the users arriving, thus eventually reaching a ceiling.
The ceiling a MAU can reach is a calculation based on the retention rates and monthly new user acquisition numbers.
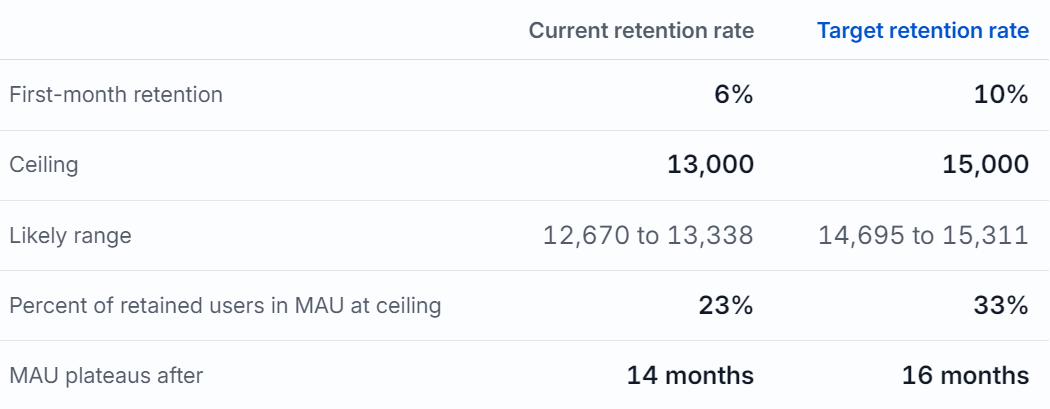
Using the example settings (10,000 new users a month, 6% first-month retention, and 80% month-over-month retention after that), the mathematical ceiling is at 13k users in total, however due to random fluctuations in retention (and the fact that cohorts can’t have fractions of a user), it will realistically land in a range between 12.6k and 13.3k.
We can also calculate that MAU plateaus after 14 months, as its month-to-month rise becomes smaller than the typical random movements in MAU.
Nevertheless, to negate the timing from the comparison we use the ceiling to compare the efficiency of the current and target retention rates.
Improving retention, increases the ceiling
At 10% first-month retention, that ceiling increases to become 15k.
At 6% first-month retention, 23% of the ceiling MAU is made up of retained users, at 10% the ceiling MAU is made up of 33% retained users.
This means that over time your MAU will contain more longer-term, loyal, engaged and monetisable users.
See how the two first-month retention rates compare over time, below:
And that is when we only consider moving the first-month retention rate, there will certainly be a knock-on effect from improving 1-month retention that will cause monthly cohorts to churn slower.
Visualising the growth over time
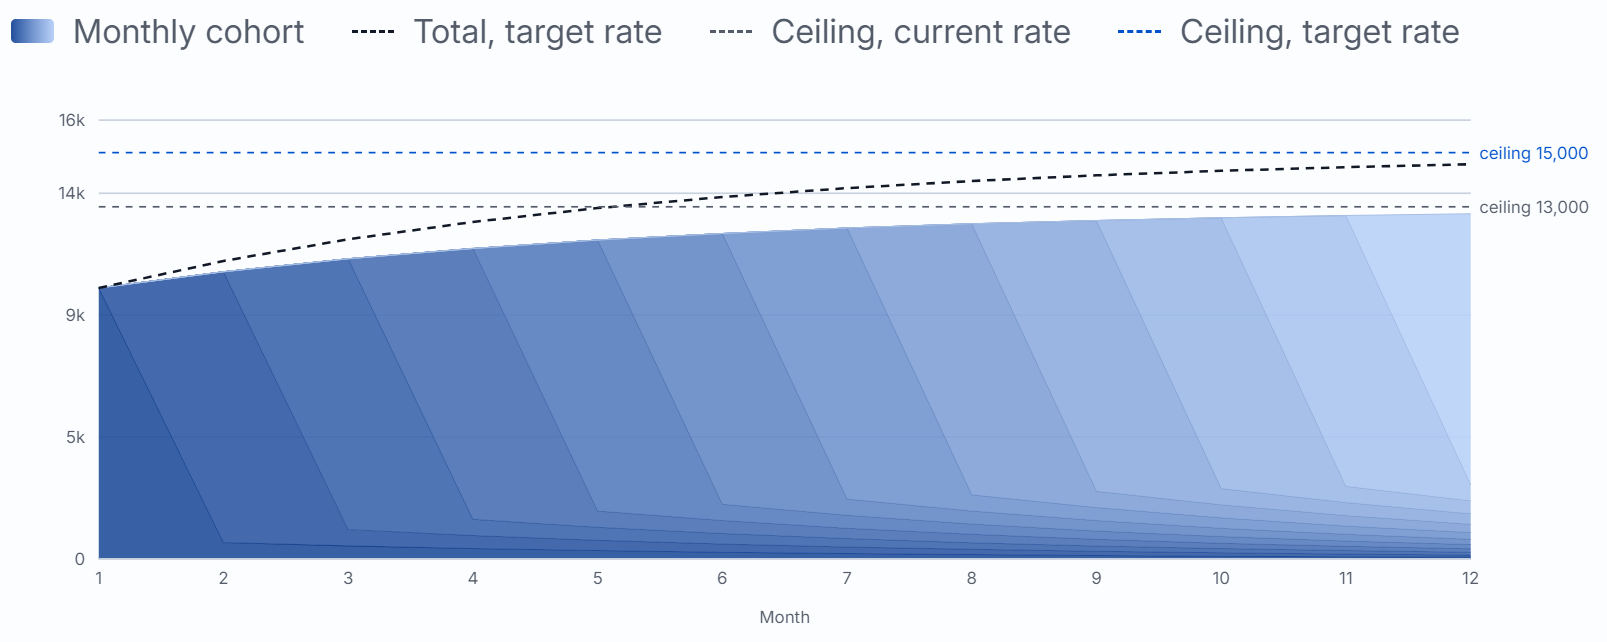
This is how it looks when we visualise each monthly cohort’s active users over time.
Each stripe in the graph below represents one cohort of users joining in a given month (monthly cohort).
And the total number from the stack represents the total Monthly Active Users (MAU) over time.
On the same chart we can see the theoretical ceilings, and how the MAU would develop for the target rate.
You can see how over time users from each monthly cohort churn, with the MAU reaching within 300 users of the 13k ceiling within 12 months.
A result of that is a small stack at the bottom of the chart that contains the retained users, at 12 months - around 21% of the MAU is made up of retained and reengaged users.
Go ahead and give it a try yourself over at the Retention Benefit Calculator
The value of retained users
Retained users are more valuable for your platform, it costs less to maintain than to acquire, they naturally spend more over time as they get value from the platform so they directly drive long-term profitability.
On top of that they increase brand equity, user satisfaction and app store visibility. The value cannot be understated.
So by working hard to improve our first month retention rate instead of throwing things at the wall and seeing what sticks, you end up with 60% more retained users after 12 months.
In part 2 of this blog, we will look at the financials and compare the savings or benefits you can reap when you bring the cost-per-acquisition (CPA) into the equation.
The system that will help you improve retention
Now we know WHY it is important to focus on retention rate, and to build a product roadmap that is data-led, that points you in the right direction of keeping users around.
My eBook, the User Engagement Blueprint is the guide written exactly for this purpose. To help you understand where to focus your app’s development efforts in order to grow your monthly retained users, through a structured approach to analysing and understanding user engagement metrics.
Get started now - get The User Engagement Blueprint for free